Projected Greenhouse Gas Concentrations
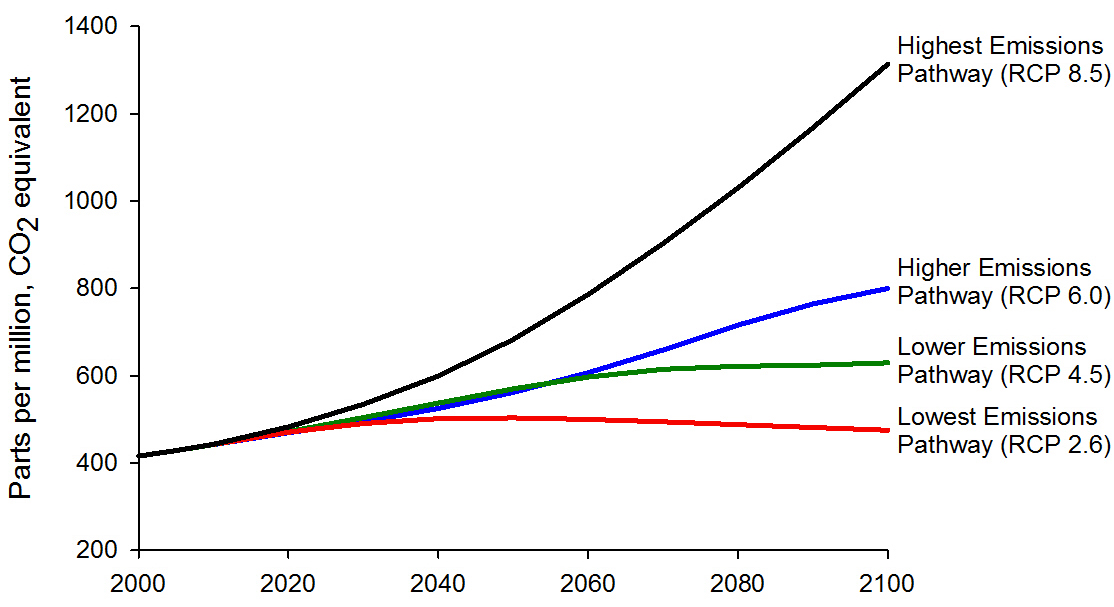
This figure shows projected greenhouse gas concentrations for four different emissions pathways. The top pathway assumes that greenhouse gas emissions will continue to rise throughout the current century. The bottom pathway assumes that emissions reach a peak between 2010 and 2020, declining thereafter.
Source: Graph created from data in the Representative Concentration Pathways Database (Version 2.0.5) http://www.iiasa.ac.at/web-apps/tnt/RcpDb